Debugging is a way to visually inspect the contents of a game and verify that the behavior is as expected. Using Debug will open at least one game process, and you can see if the game is running as expected.
The entire project is automatically saved when using Debug.
Debug Entry
Debugging can be accessed from the top of the project editing screen.

Settings
Click the button on the right to set up debugging.

Multi-client debugging
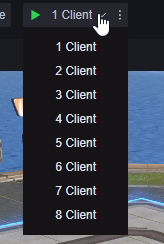
Clicking on the client area allows you to select how many clients the debugging should start with. Multi-client debugging is useful for debugging interactions between multiple players in multiplayer games.
Up to eight clients can be started at the same time.
Multi-client debugging may place a performance strain on your device
If debugging has already started, the button here will change to Add New Client.
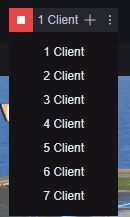
You can add up to eight clients to debug at the same time. After you add a new client, the number of clients currently opened will be updated at the top, and the number of clients that can be added will be reduced accordingly.
If you add three clients as shown in the figure above, it will become:
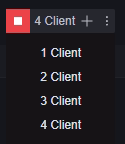
Newly added clients are considered as players joining the game mid-way. This may affect your design verification regarding players joining mid-way.
Closing a debugging window is considered as the corresponding player quitting mid-way. The current number of clients that can be added will also change. When the last debugging window is closed, this debugging will also end.
Clicking the stop button on the project editor will close all open debugging windows and end this debugging.

Debugging settings
Click the menu button on the far right of the debugger to open the debugger menu.

Startup language
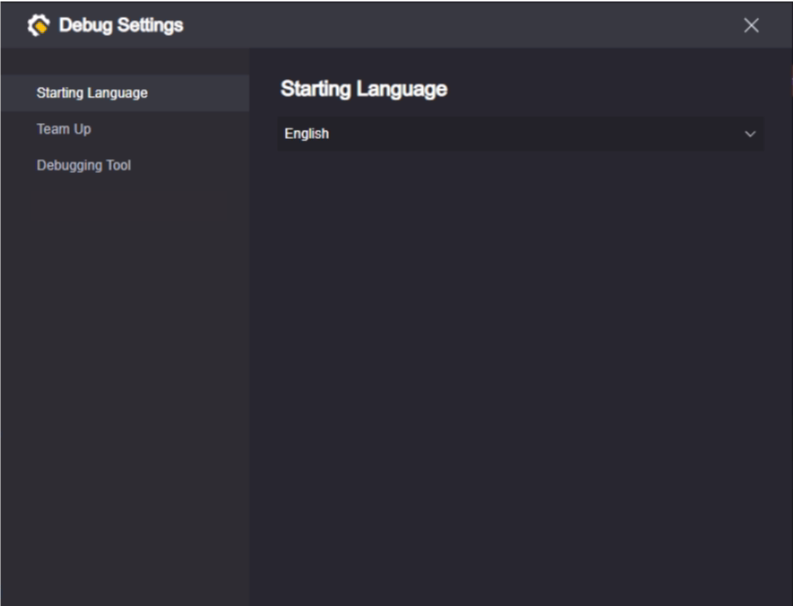
The startup language determines the language in which the various texts in your debug window are displayed.
Team
---------------------------------To be sorted--------------------------------------------
Debugging tools
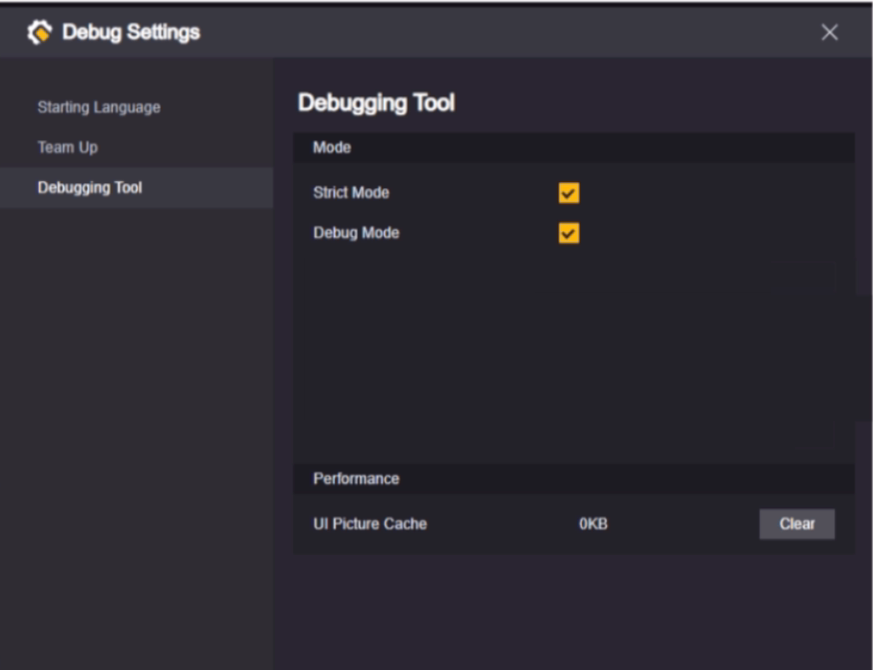
Strict mode
In strict mode, the debugger exits as soon as an error occurs in the process. This allows you to pinpoint the problem more accurately.
Debug mode
Breakpoints only take effect in Debug mode.
Breakpoints are described below.
Performance
Displays how much local storage space is currently used by the UI image cache. You can free up space by clearing the cache, but the UI images will have to be reloaded the next time they are used.
It is recommended to clear the cache when you have opened many projects and there is a lot of content in the cache that will not be used again.
Debugging windows
Game window
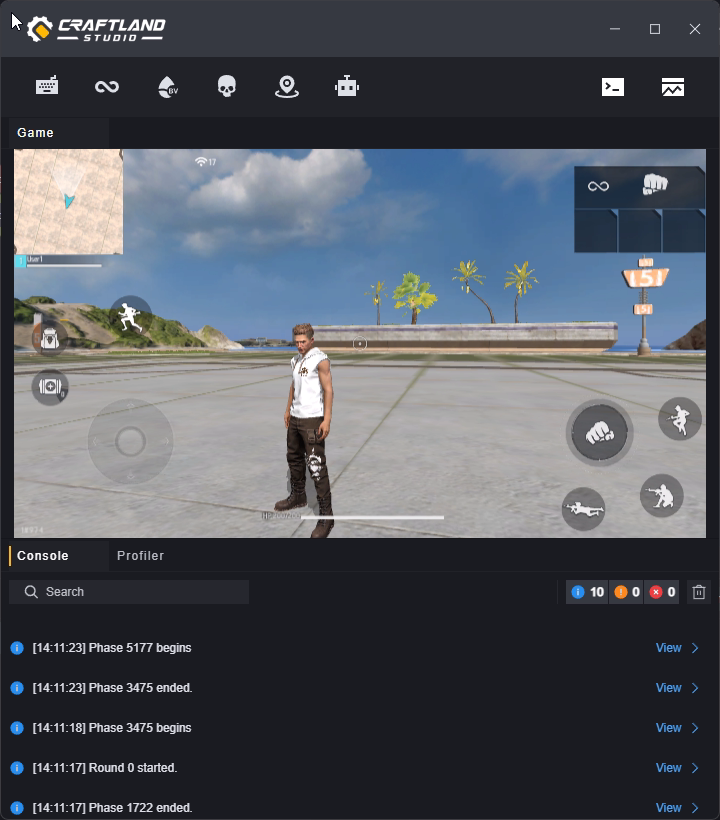
In the debug window, you can simulate playing your map. By default, your mouse is free to move, and you can simulate actions on the phone screen by clicking or holding down the left mouse button (this may be a bit awkward). Press the right mouse button in the screen area to enter the simulator operation mode, at which point your mouse movements will operate the camera rotation, the left button will become the attack command, and you can also use the keyboard to operate. For specific keyboard shortcuts, please refer to the “Keyboard” botton in the upper left corner:
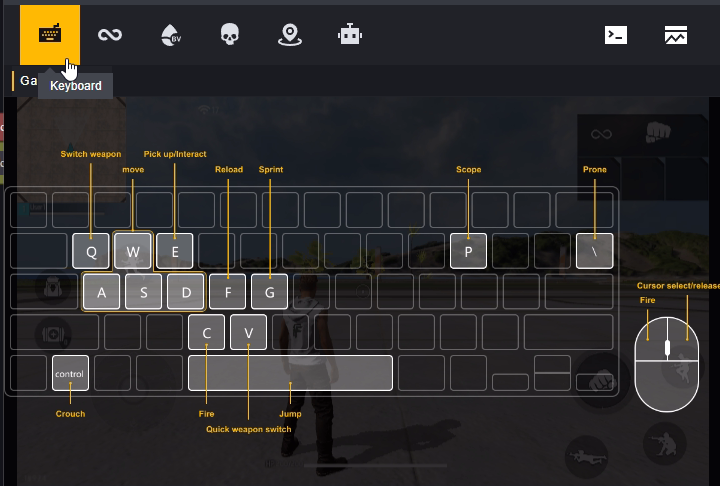
Click the right mouse button again to exit the simulator operation mode.
Menu
We have provided some default instructions and GM functions for you to use:

Keyboard: Prompt for the shortcut key for emulator operation.
Invulnerable: Toggles the invincibility status. An invincible player cannot be harmed, and the player will turn gold as a prompt that the status is turned on. Note that this command toggles the invincibility status. When the player is in the invincible state, using this command can cancel the invincibility status.
Recover HP: Directly sets the player’s health to the upper limit. Not effective for dead players.
Suicide: Kills the current player.
Teleport to Spawn Point: Teleports the player to the location where they spawned. If you have configured spawn points on the map that are available to the current player, the player will spawn at the spawn point by default. If no spawn points have been configured or the configured spawn points are not available to the current player (e.g. the team required by the spawn point does not match the player), the player will spawn near (0,0,0) and the Y-axis coordinate may be slightly adjusted.
Add a bot: Adds a bot to the current player’s team. This command cannot be executed if the current player’s team is full.
Console and performance monitoring
You can switch between the console and performance monitoring displays using the buttons in the top right and bottom centre:


Console:
Here you can view server logs, warnings and errors. The displayed information can be searched:

The type of information displayed can be filtered by clicking the button on the right:

Only display errors
Searching changes the number of displayed items, while filtering does not. The interaction of the two may prevent you from finding the information you are looking for.
Use the print node in the script to output the information you want in the corresponding category.


Performance monitoring:

Click the button in the upper right corner to start the performance test.
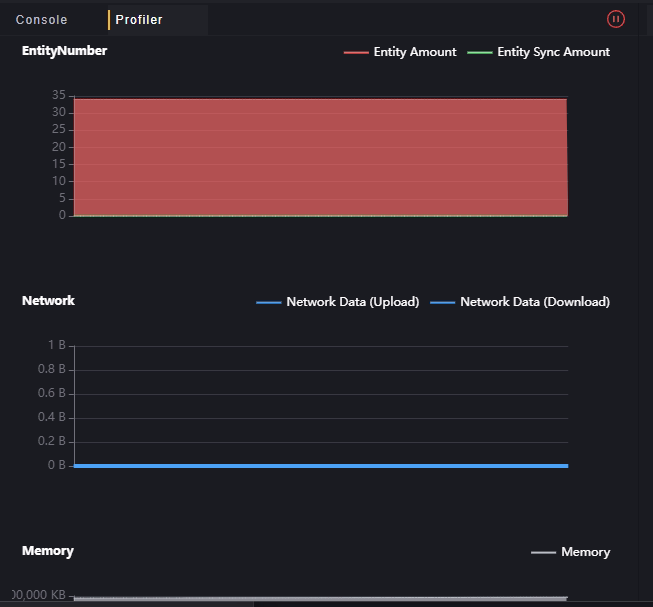
After starting the test, various performance data will be displayed in real time, allowing you to monitor the resource consumption of editing maps.
You can also artificially adjust the game’s latency and packet loss rate to test the game’s performance in a weak network environment.

The latency and packet loss rates entered here are additional values. The actual latency and packet loss rates of the game are equal to your original latency and packet loss rates plus the values entered here.
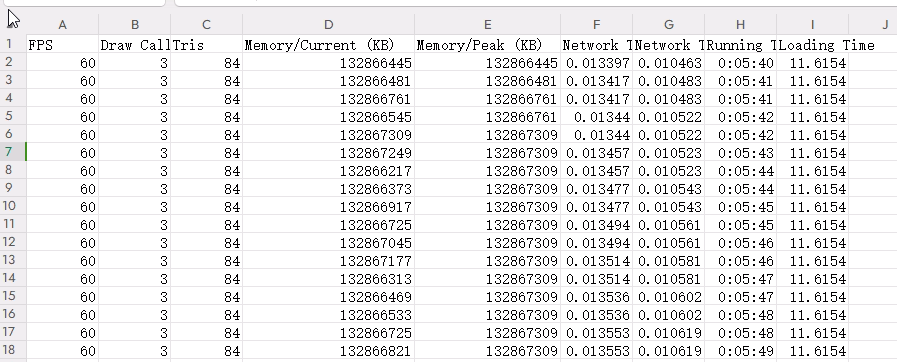
Debugging log export is supported. Click the Log button next to the test to open the exported csv file locally.

Logic and Scenario Debug Window
After starting debugging, a Logic and Scenario Debug window will open at the same time as the Debug window. It is minimized by default:
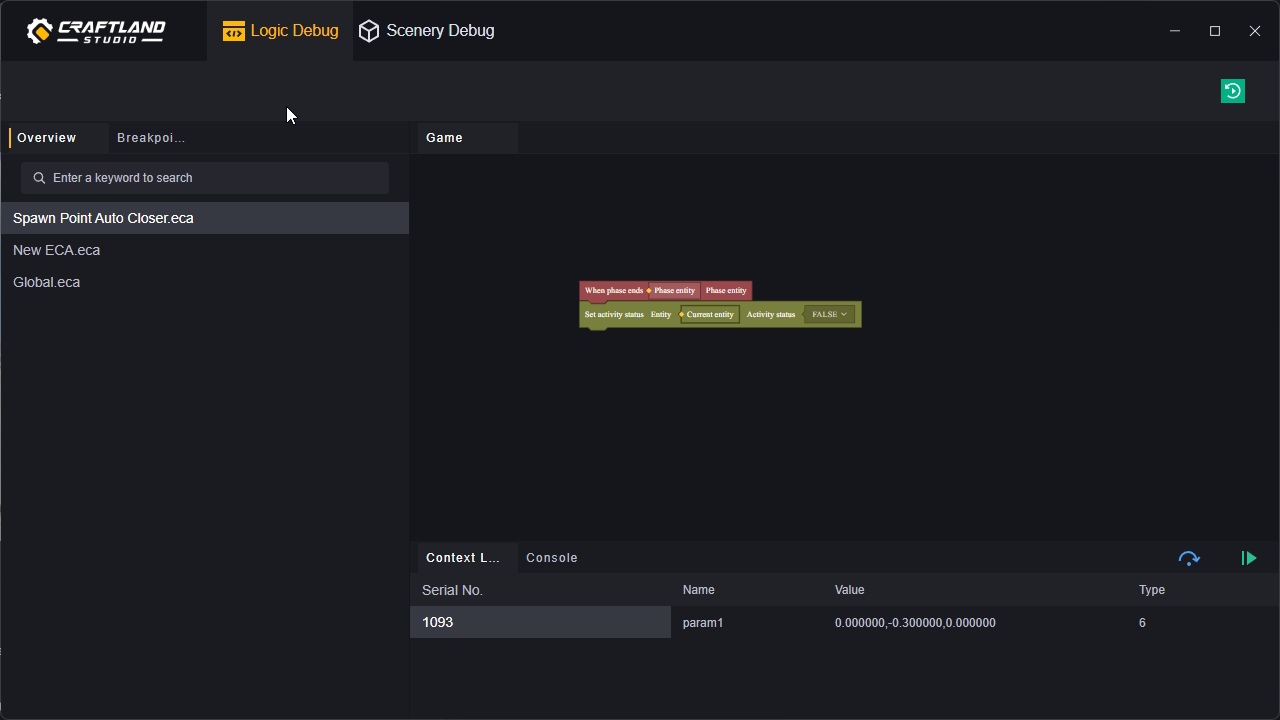
Logic debugging
You can monitor the scripting process by setting breakpoints. You can add breakpoints to nodes in the script editor or in the logic debugger to pause the game process when it reaches the breakpoint and output the variable values of the node to the context list below.
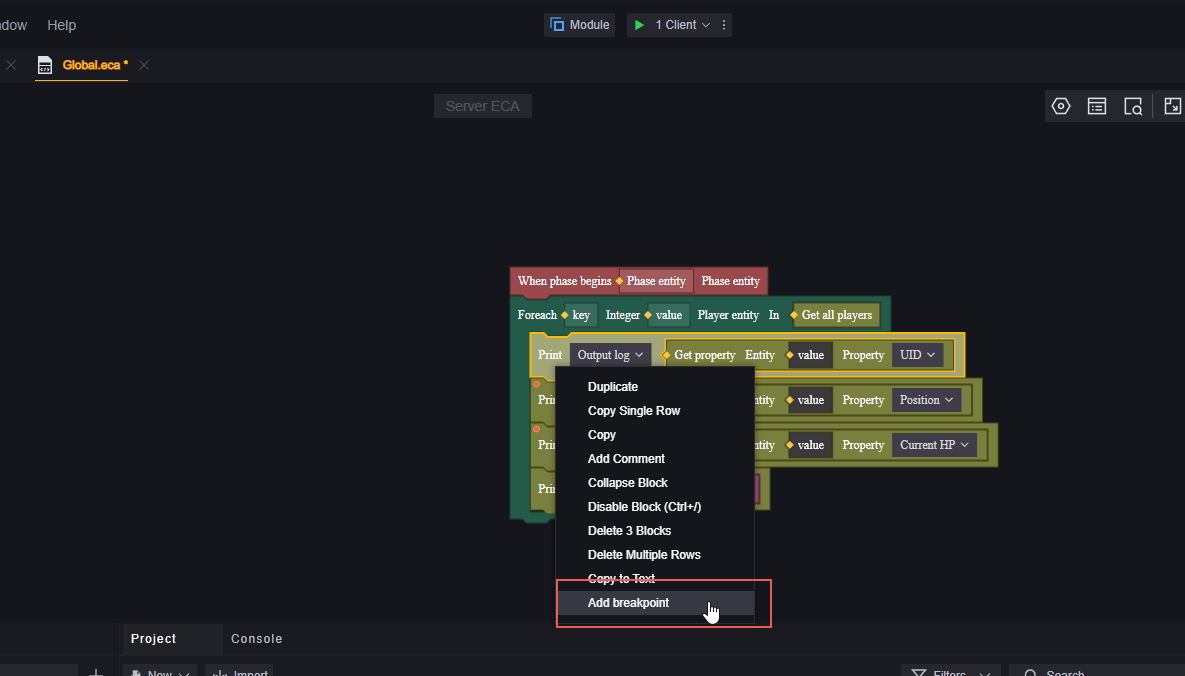
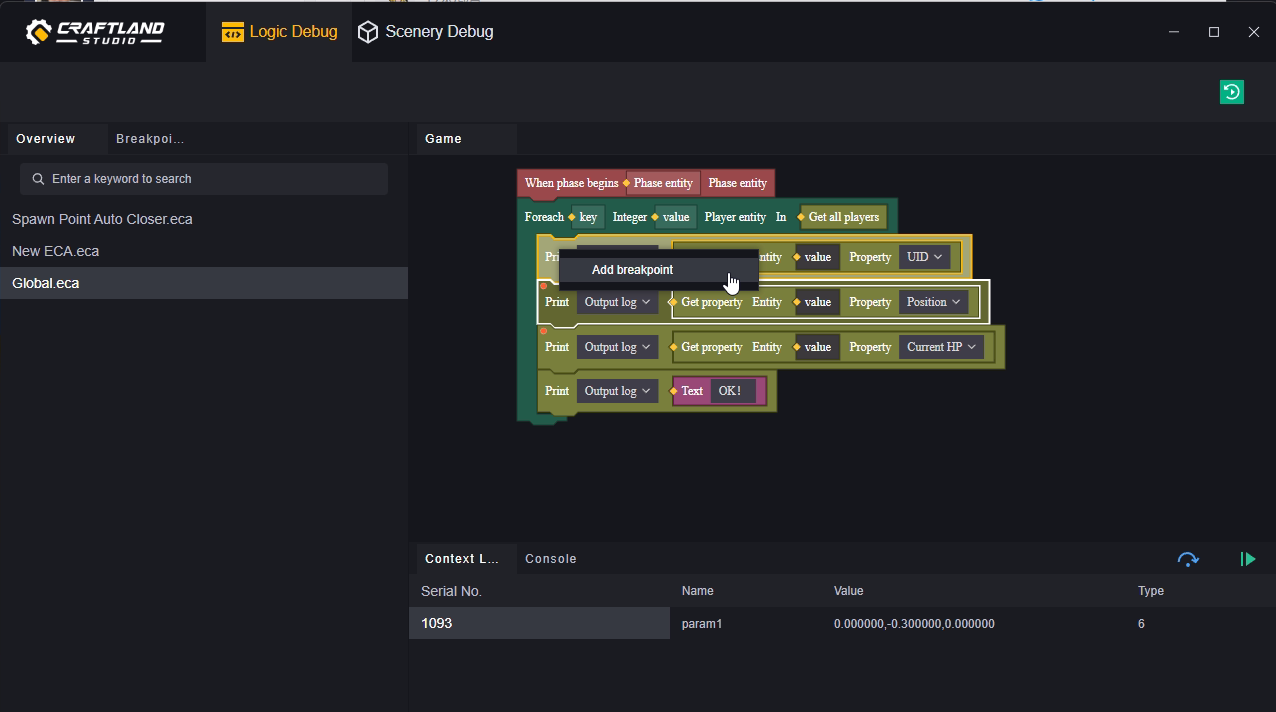
For nodes with added breakpoints, you can close or delete the breakpoints via the right-click menu.
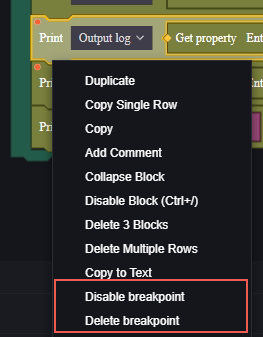
Closing a breakpoint means that it will not take effect, but you can still see a gray breakpoint symbol on the node.

Edits made to the script during debugging will not be immediately reflected in the game. You need to restart debugging to apply the new changes.
Edits to breakpoints during logic debugging will also not affect the script. Breakpoints are used during logic debugging to test temporarily required confirmations during debugging.
When a breakpoint takes effect, the game will pause.

The logic debug window will display the script where the current breakpoint is located and highlight the variable by default.
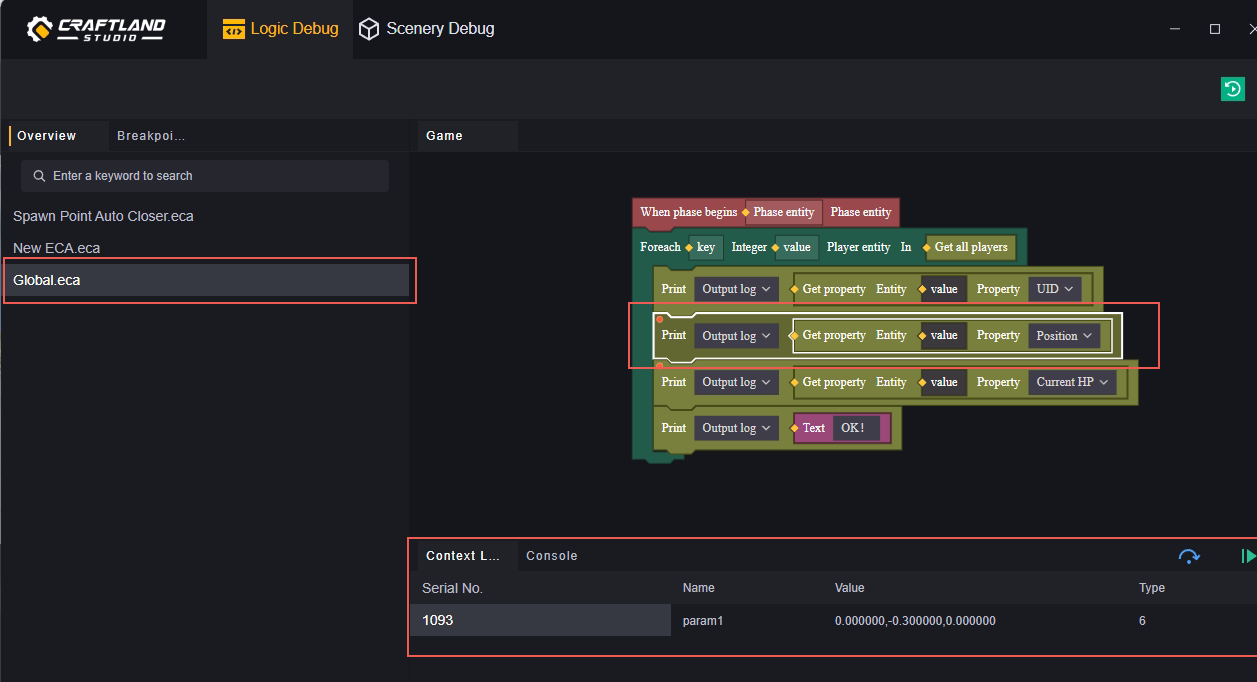
Clicking on the step will cause the game to run down one node at a time.


Click to continue, the game will run to the next breakpoint. If there is no breakpoint next, it will run normally.
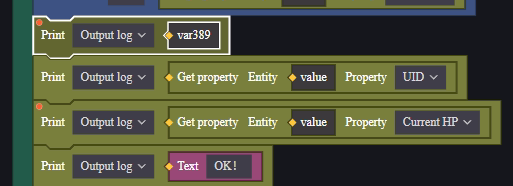

You can also view all breakpoints in the breakpoint list, which is arranged according to the rule of script name-node name where the breakpoint is located.

You can quickly change the enable state of a breakpoint (only for the current debugging) by checking the box in front of the breakpoint.
Dot in front of breakpoint: red means currently stopping at this breakpoint, gray means the breakpoint is not triggered.
Scenario debugging
In scenario debugging, you can view the list of almost all entities in the game.
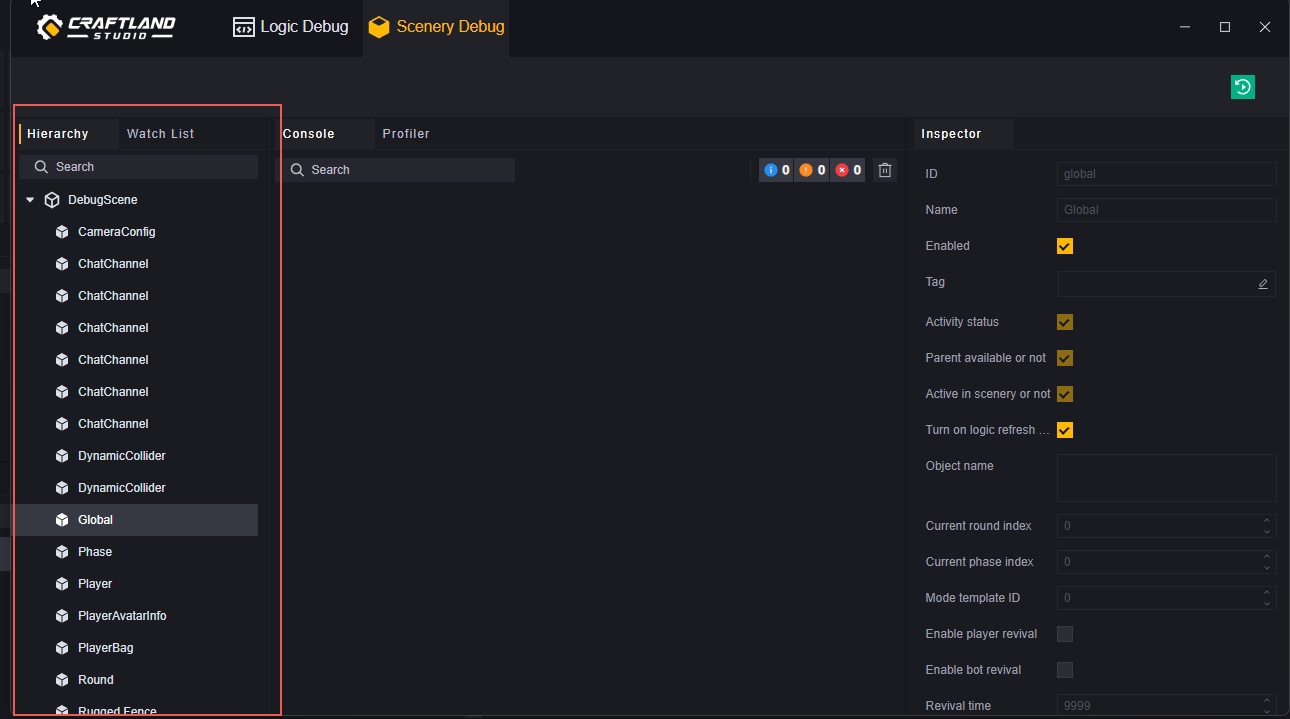
The hierarchical panel for scene debugging not only displays the custom entities you have defined in the scene, but also abstract entities (e.g. global, turn) and hidden entities.
You can modify the properties of entities in real time in the viewing panel on the right and view the corresponding display in the debugging window. This helps you to confirm the display of some designs in real time.
Click the dot to the right of an entity in the hierarchical panel on the left to add the entity to the monitoring list.
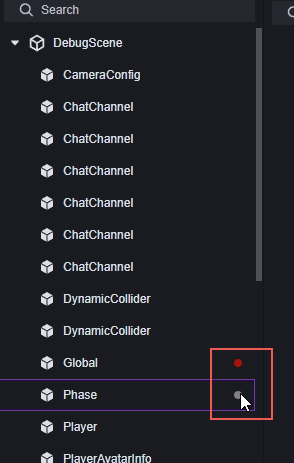
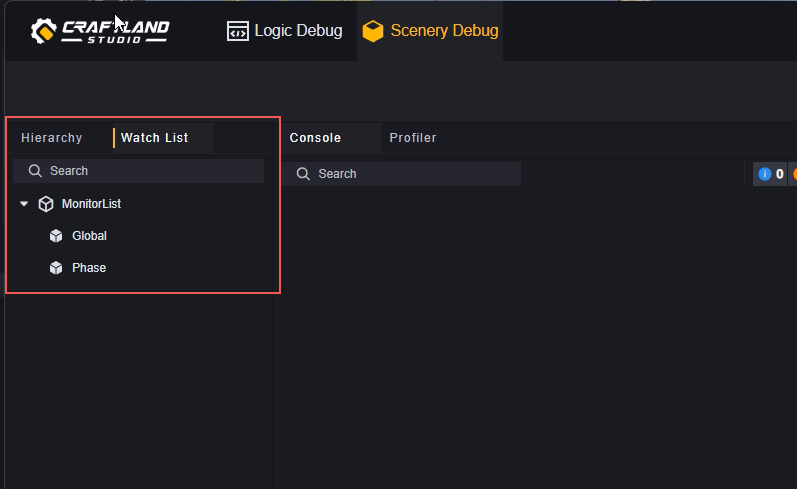
Entities added to the watchlist can be easily found in the watchlist. You can click the minus sign in the watchlist to stop monitoring this entity.
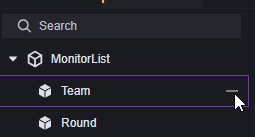
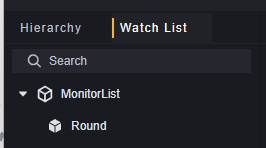
The watch list only works for the current debugging session.
Click the restart button in the upper right corner of the scene debugging, and the game will restart. This is equivalent to closing debugging and starting it again. This means that all content that affects the current debugging session will be refreshed.

Console and performance:
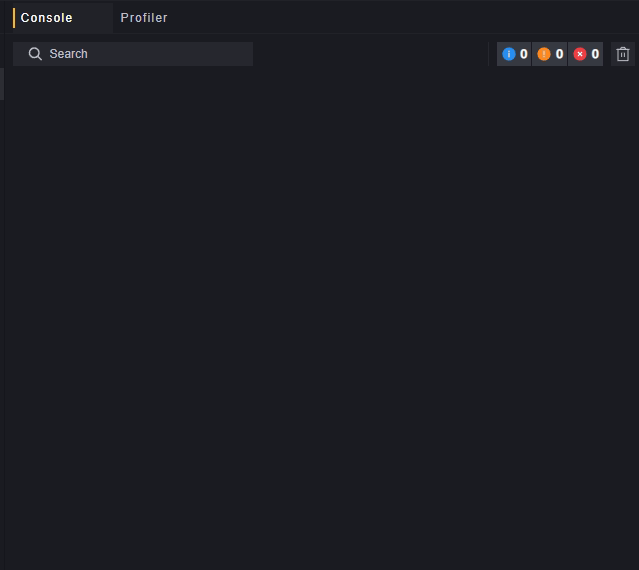
The console and performance monitoring interface is similar to the debug window.
The console and performance monitoring in scenario debugging are mainly for client information.
Starting monitoring in performance monitoring allows you to observe the number of entities, network data throughput and memory usage in real time.
